Synchronoss’ extensive history in cloud and messaging innovation led us to be early followers of the software industry microservices pattern to scale both our service development and deployment across well-defined independent services. As much in software, benefits don’t come without tradeoffs. The simplicity gained in individual microservices that can be developed independently by different teams also leads to increased complexity in interactions of the overall application. Given a single outside request can trigger numerous calls to multiple microservices behind the scenes, identification and understanding of any issue or slowness in the overall application can pose a significant challenge. Distributed tracing helps unravel that complexity.
What is Distributed Tracing?
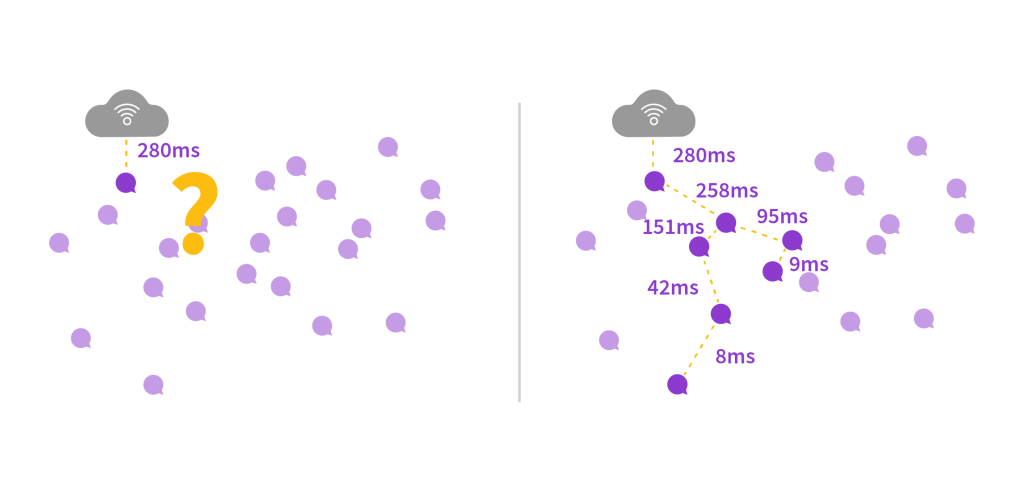
In a microservices based system a single call from an external website, app, or API can result in multiple internal calls. The end result visible from the outside is a single response and latency which is not enough to troubleshoot any issues.

Distributed tracing correlates internal microservices’ calls belonging to a single outside call and so facilitates understanding of how one outside call is fulfilled by multiple internal microservice calls. As part of correlating internal microservices’ calls, distributed tracing also measures how long each call between internal microservices takes, so it keeps records of latencies for internal microservice calls.
Distributed tracing was popularized with the technical description of Dapper, a large-scale distributed systems tracing infrastructure. Nowadays, distributed tracing is an umbrella term covering many different standards with a similar core philosophy and concepts originating from Dapper. OpenTracing, OpenTelemetry (both part of CNCF), OpenZipkin and the W3C Distributed Tracing Working Group are a few examples of groups working on distributed tracing.
Distributed tracing is a part of telemetry data, alongside application logs and metrics, commonly sent to a centralized location for system observability purposes. Application logs are structured or unstructured text entries emitted by an application. Metrics are comprised of values expressing microservice’s system characteristics like memory used, requests processed per second, etc. Distributed tracing correlates application logs and metrics from the perspective of outside call’s fulfillment. Additionally, it provides information on latency for each of calls made by a microservice, for example a call to a database, a call to another microservice, etc.
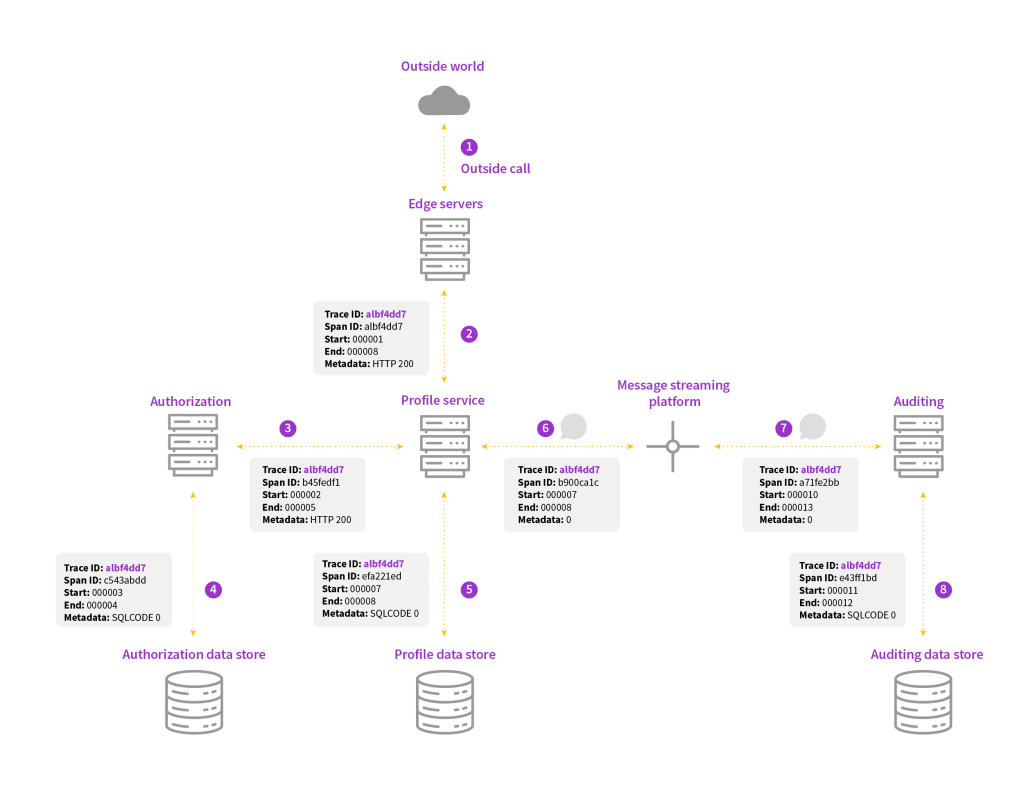
The common thread for distributed tracing involves an early entry point into the overall system creating a correlation id (also called a trace id). This same trace id is propagated to all downstream service calls that partake in the original call’s fulfillment, commonly through HTTP headers but other application protocol headers/metadata are options as well in the case of gRPC, Kafka , AMQP, JMS-based protocols, JDBC, etc. Each service call or distinct operation or activity additionally has its own identifier created, often called a span id, underneath that same trace id. Latency of the span is then captured automatically as the subtraction of stop time with start time.
Further Data Capture and Reporting
In addition to latency, additional call metadata can be captured including system identifiers, error codes, messages, method and class names, JDBC redacted queries, or anything of value for the operations teams as key/value pairs. HTTP client libraries, as well as other application protocol client libraries, MVC frameworks, and other key I/O or compute intensive areas are instrumented to capture this information for every service in a consistent manner.
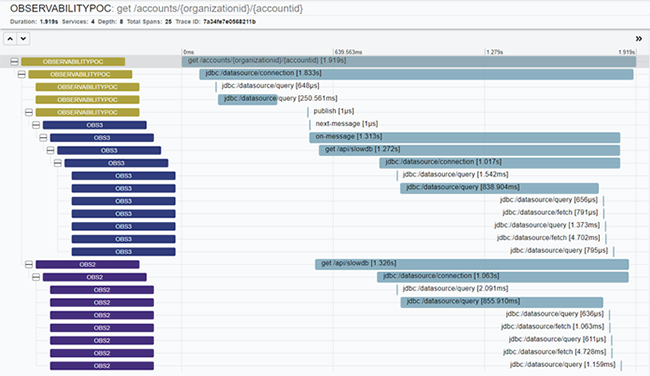
All captured information from every microservice is sent over a highly available message streaming platform to a backend server that is the nexus of all tracing information and allows searching for specific trace id’s, errors, slowness, or other information as well as providing timeline visualizations of latency.

Correlating what might otherwise be an avalanche of detailed application and access logs to trace information is a key component of the system as well. We include and index trace id and span id information on every log entry made by any service partaking in servicing a call. The result is easy searching for any additional errors, warnings, or auxiliary information which can be reviewed for clues and patterns that could explain any issues occurring.

How Distributed Tracing Helps our Customers
Distributed tracing allows us to quickly troubleshoot any issues in our internal microservices’ calls fulfilling the outside request. It increases our ability to understand and isolate performance issues and tames the complexity of microservices at scale.
